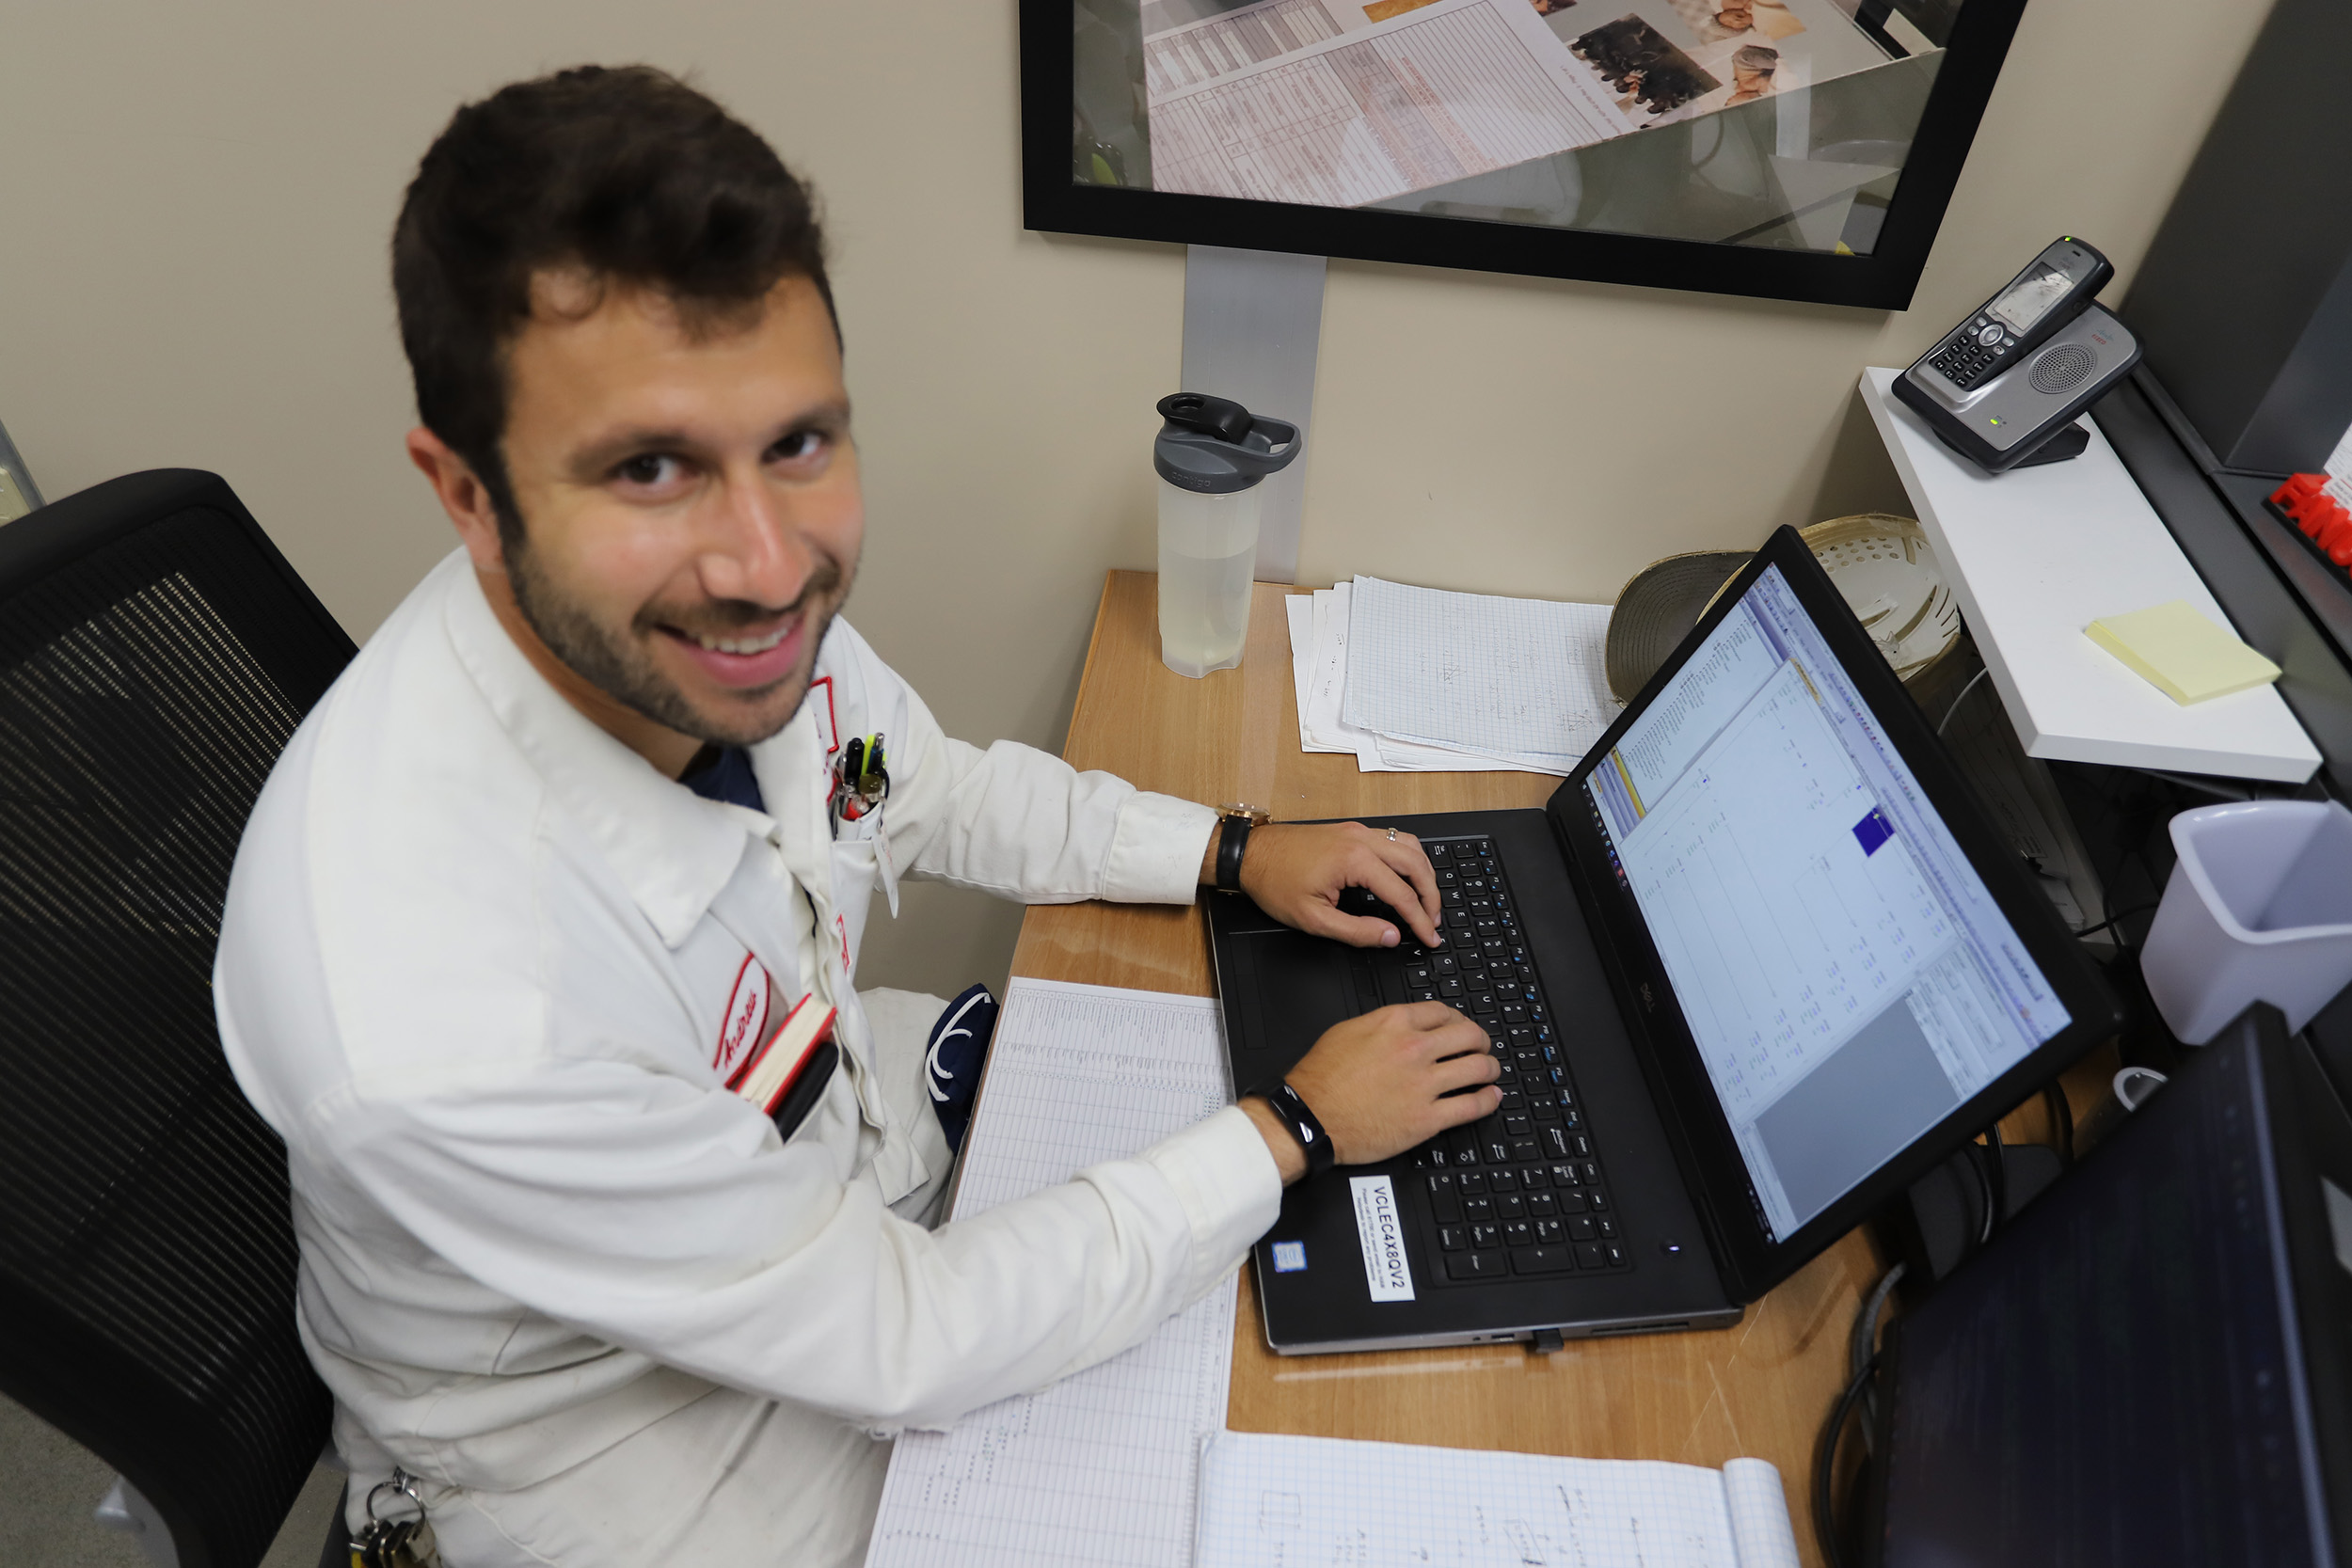
Anna Engine Plant’s Andrew Greenfield shows how an algorithm can make all the difference…and how never giving up can make an algorithm shine.
Efficiency is important at Honda. An efficient method improves processes, saves time and money, allows things to run according to schedule, and maybe most importantly, it frees up time for creativity and innovation.
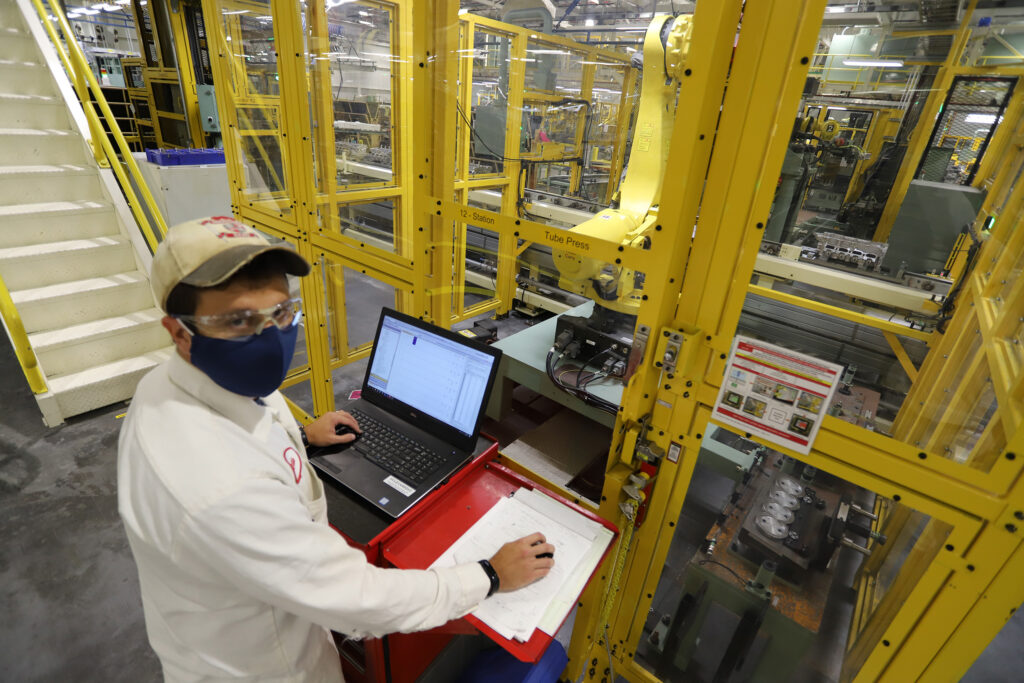
As a systems engineer at the Anna Engine Plant (AEP), Andrew Greenfield spends much of his time looking for efficiencies in the hundreds of manufacturing processes that take place at Honda’s largest engine plant in the world. The plant’s Valve Line 4 is one such area, and when Greenfield was asked to look at it with his watchful eye, the line had not reached its target run rate for nearly three years.
Getting started
After poring over reams of data and trying a myriad of methods to solve the run rate issue, Greenfield developed an algorithm for the Programmable Logic Controller (PLC) that allowed the team to quickly identify issues that would provide the greatest benefit in improving the process.
One of those items was run rate, which is calculated based on the overall time used to create each day’s products.
“The algorithm allowed us to focus on issues that mattered,” Greenfield said. “Prior to the algorithm, we saw the numbers and we did things to change or improve processes based on those numbers, but they weren’t affecting the run rate like we assumed they would. We had to find out why so we could improve the final product. The algorithm changed the game by highlighting issues that would have the greatest impact on efficiency, thereby improving run rate.”
For example, Valve Line 4 starts with the cylinder heads being loaded into the line. There are 16 stations along the line that perform processes before the piece is sent to the unload (final) station.
The daily process data in our example might show 62 minutes of overall down time, but the run rate might only show 20 minutes. This would mean that 42 of the 62 minutes of down time recorded had no real effect on run rate.
The team knew that when a product goes through that many stations, there is a chance that a gap at an early station is made up later in the process, having no effect on the run rate.
So at first, the team tackled the problem using those raw numbers, figuring bigger down time numbers meant bigger problems. But as the weeks went on, they found themselves playing the engineering equivalent of Whack-A-Mole.
Beating the game
“We made improvements to the head load and cut those down time numbers in half, but it still wasn’t changing the run rate,” recalled Greenfield.
“We changed another station and reduced 75% of its down time and it still did not affect the run rate. Engineers and equipment services personnel were reducing down time numbers as reported by production associates (who themselves would look at alarms and over cycle time data), with no appreciable gains made.”
Greenfield’s algorithm was able to change that game and by measuring physical gaps for each station throughout the day, comparing those gaps to the line’s target cycle time, and then recording the total amount of physical gap produced by each station.
Then, in order to accurately measure the down time, Greenfield identified the stopper at the end of the line as the tilting point. This is important as once the cylinder head passes the stopper and unloads, it is considered a finished good. If the final stopper that sends a part to unload does not have a part to work on, it creates a loss in production, so Greenfield identified this process as the ideal starting point for his plan.
For example, if the run rate showed a 65-second gap at the end of the day, the algorithm programmed into the PLC used the data to work backwards to determine what processes needed fixing.
If Station 12 had a 20-second gap, the team found out how to eliminate that gap. The process would then work backward, until they eliminated the 65 seconds of gap, surmising that any excess down time shown in the real-time monitoring system would work itself out by the time the part made it to the end of the process.
Reaping the rewards
The new tracking and repair method paid immediate dividends on Valve Line 4 in its first month of implementation, showing improvements of more than 2.5%. Valve Line 4 made its target run rate in 96Ki for the first time since the line started up three years prior.
The solution improved production enough that AEP raised the production capacity of Valve Line 4 by 300 units/day, up 10.7% from the original target the line was put in to produce.
Greenfield went on to present his algorithmic solution at TechFest (more recently called Technical Exchange), where it received rave reviews.
And while Greenfield’s algorithm played a key role in getting Valve Line 4 back to where it needed to be for optimal production, he is quick to credit the entire team that worked to find improvements on the project.
“This program didn’t suddenly make the line magically better. The engineers and equipment service on Valve Line 4 had made a good amount of progress on a line that had a rough start,” he said. “All I did was offer a different perspective and sort of change where the improvement activity was focused.
“To me, the coolest thing about a successful project like this is seeing how much better it makes everyone’s lives at work. Any time you can help a line that’s struggling to make its target production means production associates, offline assists, and team leaders don’t have to try and run through lunch and breaks.
“It’s truly everyone’s problem when you’re not able to make the requisite number of parts in a day. Anything we can do to solve those issues has an impact on morale and helps the entire team.”
And that’s the real point of the numbers Greenfield uses and the algorithm he builds: to help fellow associates grow and have greater success.